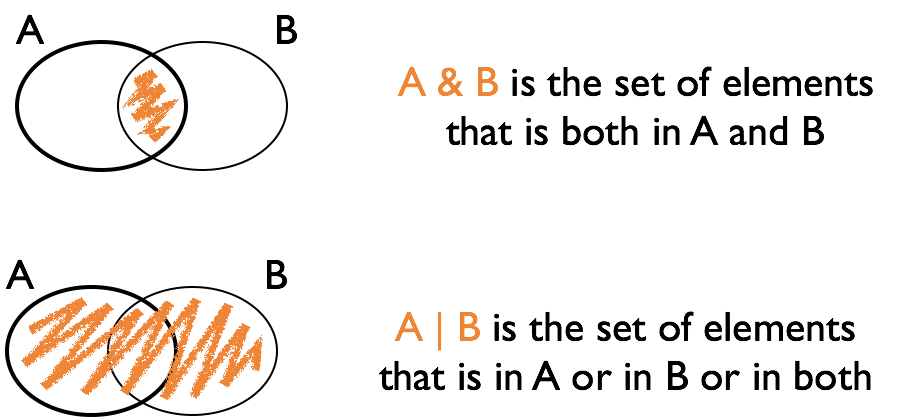
class: center, middle, inverse, title-slide # Logical variables and filters --- ## Data types in R - logical: boolean values - ex. `TRUE` and `FALSE` - double: floating point numerical values (default numerical type) - ex. `1.335` and `7` - integer: integer numerical values (indicated with an L) - ex. `7L` and `1:3` - character: character string - ex. `"hello"` - lists: 1d objects that can contain any combination of R objects - more on this later - & more, but we won't be focusing on those --- class: inverse, middle, center # Logical vectors --- ## Logical vectors - Vectors consisting of values `TRUE` and `FALSE` - Very important! - Usually created with a logical comparison - `<, >, ==, !=, <=, >=` - `x %in% c(1, 4, 3, 7)` - `subset` or `dplyr::filter` --- ## Logical expressions - `&` and `|` are the logical *and* and *or* - `!` is the logical negation - use parentheses () when linking expressions to avoid mis-interpretation --- ## Logical Operations <br/><br/>  --- class: yourturn .center[ # Your turn ] Define vector `a` to be `a <- c(1,15, 3,20, 5,8,9,10, 1,3)` <br/> Find the expression for the logical vector that is TRUE where `a` is: - less than 20 - squared value is at least 100 or less than 10 - equals 1 or 3 - even - **Hint**: have a look at the help for the operator `%%` ``` ?`%%` ``` --- class: inverse, center, top background-image: url(https://github.com/allisonhorst/stats-illustrations/blob/master/rstats-artwork/dplyr_wrangling.png?raw=true) background-size: 650px background-position: 50% 85% # filter {dplyr} --- background-image: url(https://raw.githubusercontent.com/rstudio/hex-stickers/master/PNG/dplyr.png) background-size: 120px background-position: 92% 5% ## `dplyr::filter()` `filter(data, ...)` allows you to subset observations based <br> on their values. - The first argument, `data`, is the name of the data frame. - The second and subsequent arguments, `...`, are the expressions <br> that filter the data frame. <br/> `filter()` is a command of package `dplyr` - the package `dplyr` is loaded by the package `tidyverse` <br/> Things to be aware of: - The command `subset` works very similarly. - ⚠️ there is another function called `filter` in the `stats` package. - Use `::` to make sure you use the right one: `dplyr::filter` --- background-image: url(https://raw.githubusercontent.com/rstudio/hex-stickers/master/PNG/dplyr.png) background-size: 120px background-position: 92% 5% ## `dplyr::filter()` usage `filter(data, ...)` finds subset of `data` where conditions <br>specified by a logical expression in `...` are true, - `filter(fbi, Year == 2014)` <br/> To save the result, you’ll need to use the assignment operator, `<-`, - `fbi14 <- filter(fbi, Year == 2014)` <br/> Multiple expressions are combined by a logical "and" (i.e. `&` ) - `filter(fbi, Type == "Larceny.Theft", State %in% c("Iowa", "Minnesota"))` <br/> ⚠️ `filter()` only includes rows where the condition is `TRUE` - i.e. it excludes both `FALSE` and `NA` values. - If you want to preserve missing values, ask for them explicitly. ??? The first argument is the name of the data frame. The second and subsequent arguments are the expressions that filter the data frame. For example, ... When you run that line of code, dplyr executes the filtering operation and returns a new data frame. dplyr functions never modify their inputs, so if you want to save the result, you’ll need to use the assignment operator, <-: R either prints out the results, or saves them to a variable. To do both... --- class: yourturn .center[ # Your turn ] - Get a subset of all crimes in Iowa. Plot incidences/rates for one type of crime over time. - Get a subset of all crimes in 2009. Plot the number or rate for one type of crime by state. - Get a subset of the data that includes number of homicides for the last five years. Find the rate of homicides, extract all states that have a rate of greater than 90% of the rates across all states, and plot (Hint: `?quantile`). --- ## Useful commands Number of records in a data set: `nrow(dataset)` Quantiles: `quantile(variable, probs=0.001, na.rm=T)` Find all indices for which the expression is TRUE: `which(logical variable)` Retrieve index of maximum/minimum value: `which.max(variable)` `which.min(variable)` --- class: yourturn .center[ # Your turn ] ```r fbi <- read.csv("https://raw.githubusercontent.com/Stat480-at-ISU/materials-2020/master/02_r-intro/data/fbi.csv") fbiwide <- read.csv("https://raw.githubusercontent.com/Stat480-at-ISU/materials-2020/master/02_r-intro/data/fbiwide.csv") ``` Use the `fbi` data object to answer the following questions: - In which year did California have the greatest number of <br> burglaries reported? - for any of the violent crimes, which state had the highest rate (and for which crime) in 2014? in 1961? Use the `fbiwide` data object to answer the following question: - in 2011, how many states had fewer vehicle thefts than robberies? (which states are those?) --- ## Updating elements in a vector You can take a subset and update the original data: ```r a <- 1:4 a ``` ``` ## [1] 1 2 3 4 ``` ```r a[2:3] <- 0 a ``` ``` ## [1] 1 0 0 4 ``` ```r replace(a, a == 0, -1) ``` ``` ## [1] 1 -1 -1 4 ``` <br/> 👍 Very useful in combination with logical subsetting --- ## Updating elements in a data set Data sets and their parts can be used on both sides of an assignment: ```r library(classdata) # introduces new variable in the data set fbiwide fbiwide$murder_rate <- fbiwide$Murder/fbiwide$Population*100000 names(fbiwide) ``` ``` ## [1] "State" "Abb" "Year" ## [4] "Population" "Aggravated.assault" "Burglary" ## [7] "Larceny.theft" "Legacy.rape" "Motor.vehicle.theft" ## [10] "Murder" "Rape" "Robbery" ## [13] "murder_rate" ``` <br/> If that variable exists before, it is being over-written/updated --- class: yourturn .center[ # Your turn ] The gapminder data we originally worked with is available [here](https://stat480-at-isu.github.io/materials-2020/01_collaborative-environment/data/gapminder-5060.csv). - `read.csv` helps you read the gapminder from the given link. Store the result in an object. - What format does the object have? - Replace the problematic value in life expectancy for Canada in 1957 by 69.96. --- ## Resources - reference/document: http://dplyr.tidyverse.org/reference/ - RStudio cheat sheet for [dplyr](https://github.com/rstudio/cheatsheets/raw/master/data-transformation.pdf) - Artwork by [@allison_horst](https://twitter.com/allison_horst?ref_src=twsrc%5Egoogle%7Ctwcamp%5Eserp%7Ctwgr%5Eauthor)