Applied Statistical Computing
Spring 2020
T/R 9:30 - 10:50, Gilman 2272
Instructor: Haley Jeppson, hjeppson at iastate dot edu
office hours: Tuesday 8:30-9:30am,
Gilman 2272, or by appt.TA: Haijuan Zhang, haijuan at iastate dot edu
office hours: Monday/Wednesday 3-4pm
Snedecor 1404
COVID-19 UPDATES:
(as of 3/24)
Due to the COVID-19 pandemic, ISU has decided to move all courses to virtual instruction for the remainder of the spring semester. A summary of the changes that will need to be made to our class structure is provided below.
Regarding lectures:
- The class schedule has now been updated and the links to slides will be added weekly.
- The lectures will be held as a Zoom meeting at the usual lecture time. Please check the home page for our class on canvas for instructions on how to access the Zoom meeting. I will send out recordings of the lectures after the lecture is complete. Please note, this format is subject to change as I am evaluating this process day by day.
- To encourage you to stay on schedule, I would like you to submit your "your turn" attempts on canvas within 48 hours of the scheduled lecture time. If, for whatever reason, you are unable to complete the exercises within that time, please let me know.
Regarding office hours:
- If you have any questions regarding the material/homework, please post the question as a discussion item on canvas, or email me or Haijuan.
- My office hours will be held as a Zoom meeting. Please check the home page for our class on canvas for instructions on how to access the Zoom meeting.
- Haijuan will be holding office hours each week on Mondays and Wednesdays 3-4 pm. She will also hold her office hours as a Zoom meeting. Please note that there is a separate link/meeting ID for Haijuan's office hours. Check the home page for our class on canvas for instructions on how to access the Zoom meeting.
Regarding the midterm and the final projects:
- The midterm is now a stay-home exam. It will be posted at 3pm on Wednesday, April 8th and the exam will be due at 3pm on Friday, April 10th.
- The plan for final group projects will remain the same that except your team will now record your presentation and share it with the class through canvas.
Course description:
Not all data lives in nice, clean spreadsheets, not all data fits in a computer's main memory. As statisticians we cannot always rely on other people and sciences to get the data into formats that we can deal with: we will discuss aspects of statistical computing as they are relevant for data analysis. Read and work with data in different formats: flat files, databases, web technologies. Elements of literate programming help us with making our workflow transparent and analyses reproducible. We will discuss how to communicate our results in form of R packages and interactive web applications.
Learn how to:
- Learn how to deal with complex, messy, real data
- Use graphics to explore and understand data
- Gain familiarity with basic data collection, storage and manipulation
- Fluently reshape data into the most convenient form for analysis or reporting
- Automate cleaning and analysis in R.

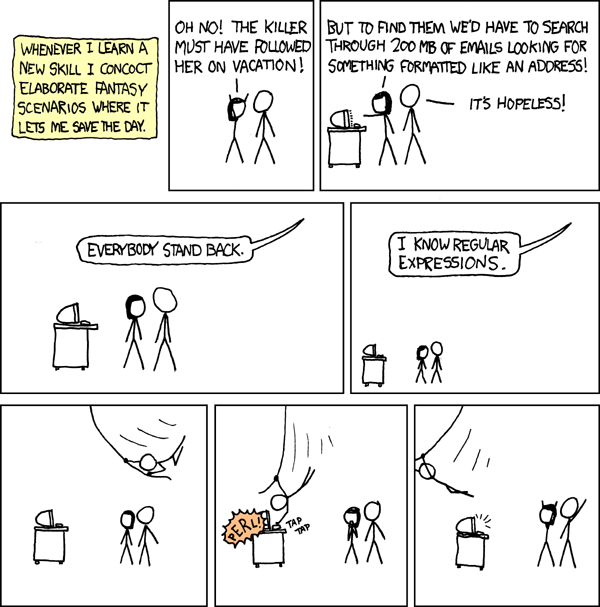
Regular expressions. https://imgs.xkcd.com/comics/regular_expressions.png
More info:
Use the navigation bar above!The course organization on GitHub: https://github.com/stat480-at-ISU
Repo that creates this website: https://github.com/Stat480-at-ISU/Stat480-at-ISU.github.io